Apple economics: devices, services, and margin
TL;DR: Apple earns most of its revenue from devices but a growing share of profit from services. From 2022 to 2024, total net sales moved from $394.3B to $383.3B to $391.0B. Over the same period, services net sales rose from $78.1B to $85.2B to $96.2B, and services carried a gross margin of about 73.9 percent in 2024 compared with about 37.2 percent for products.
Revenue and profit from 2022 to 2024
Net sales dipped in 2023, then recovered in 2024, while operating income and gross margin stayed strong. Net income was lower in 2024 than in prior years, in part because of a one time tax charge tied to a European State Aid decision. Even with that charge, the company produced more than $93B of net income in 2024.
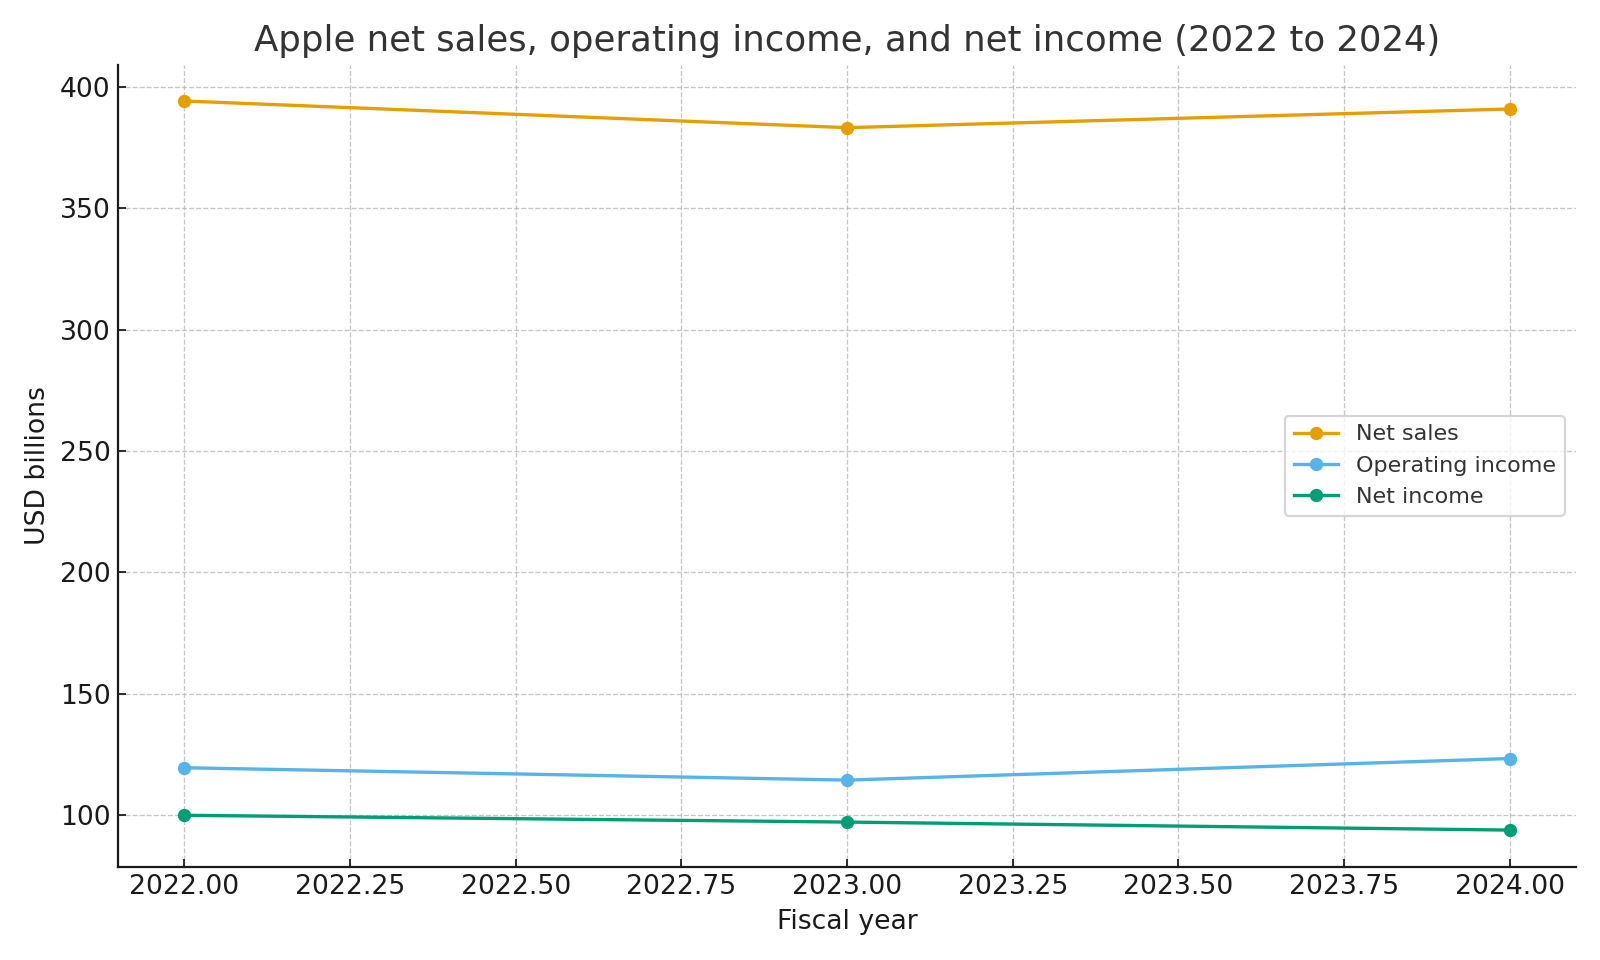 Net sales, operating income, and net income 2022 to 2024
Products and services mix
Most net sales still come from products, led by iPhone, Mac, iPad, and Wearables. Product net sales declined from about $316.2B in 2022 to about $294.9B in 2024. Services moved the other way, growing from about $78.1B to about $96.2B over the same period.
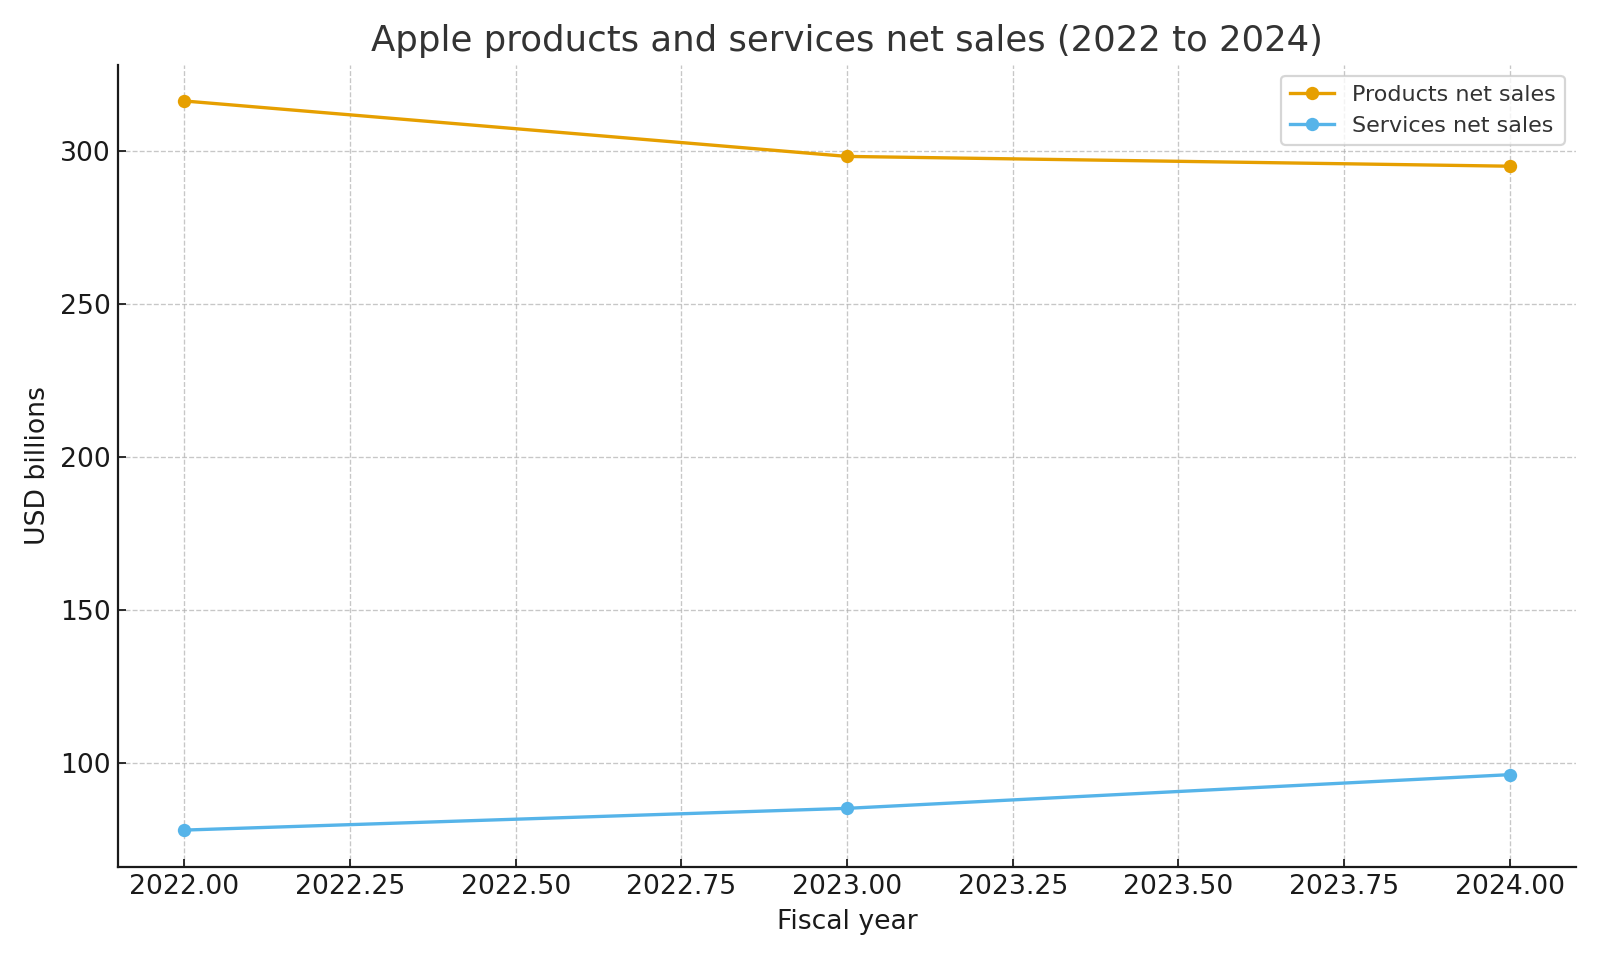 Products and services net sales 2022 to 2024
In 2024, products made up about 75.4 percent of net sales and services made up about 24.6 percent. That mix shows how important services have become even though devices still bring in most of the top line.
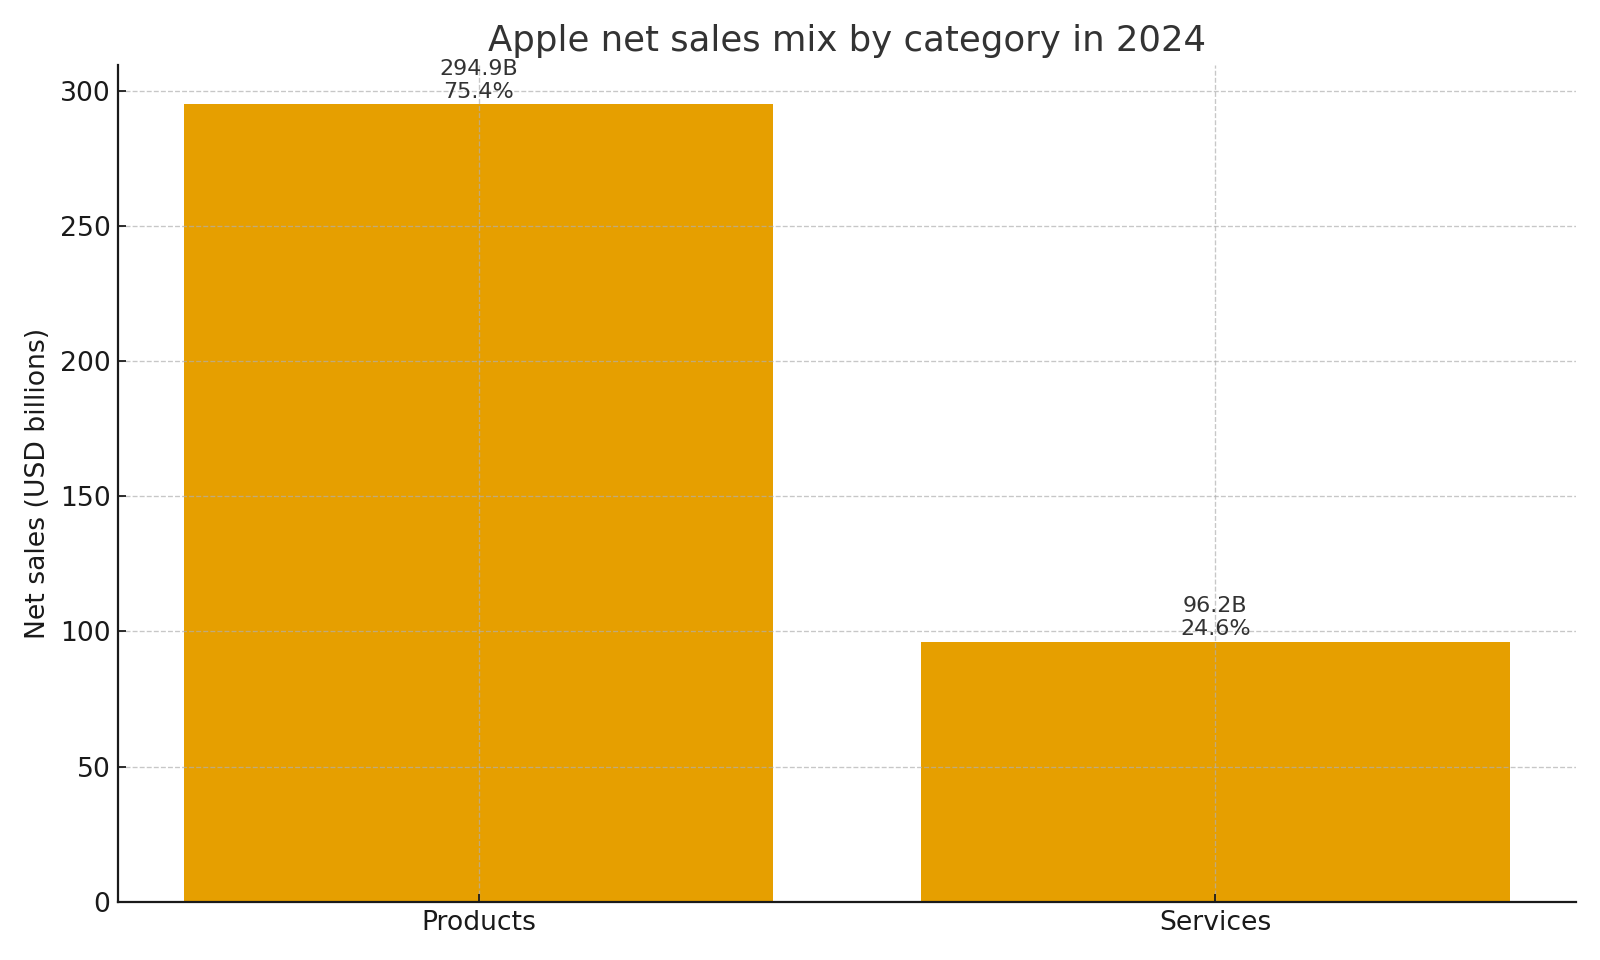 Products versus services mix in 2024
Margins and why services matter
Services carry much higher gross margin than products. From 2022 to 2024, products gross margin stayed in the mid thirties, while services gross margin stayed in the low seventies and rose to nearly 74 percent in 2024. Total gross margin moved from about 43.3 percent in 2022 to about 46.2 percent in 2024.
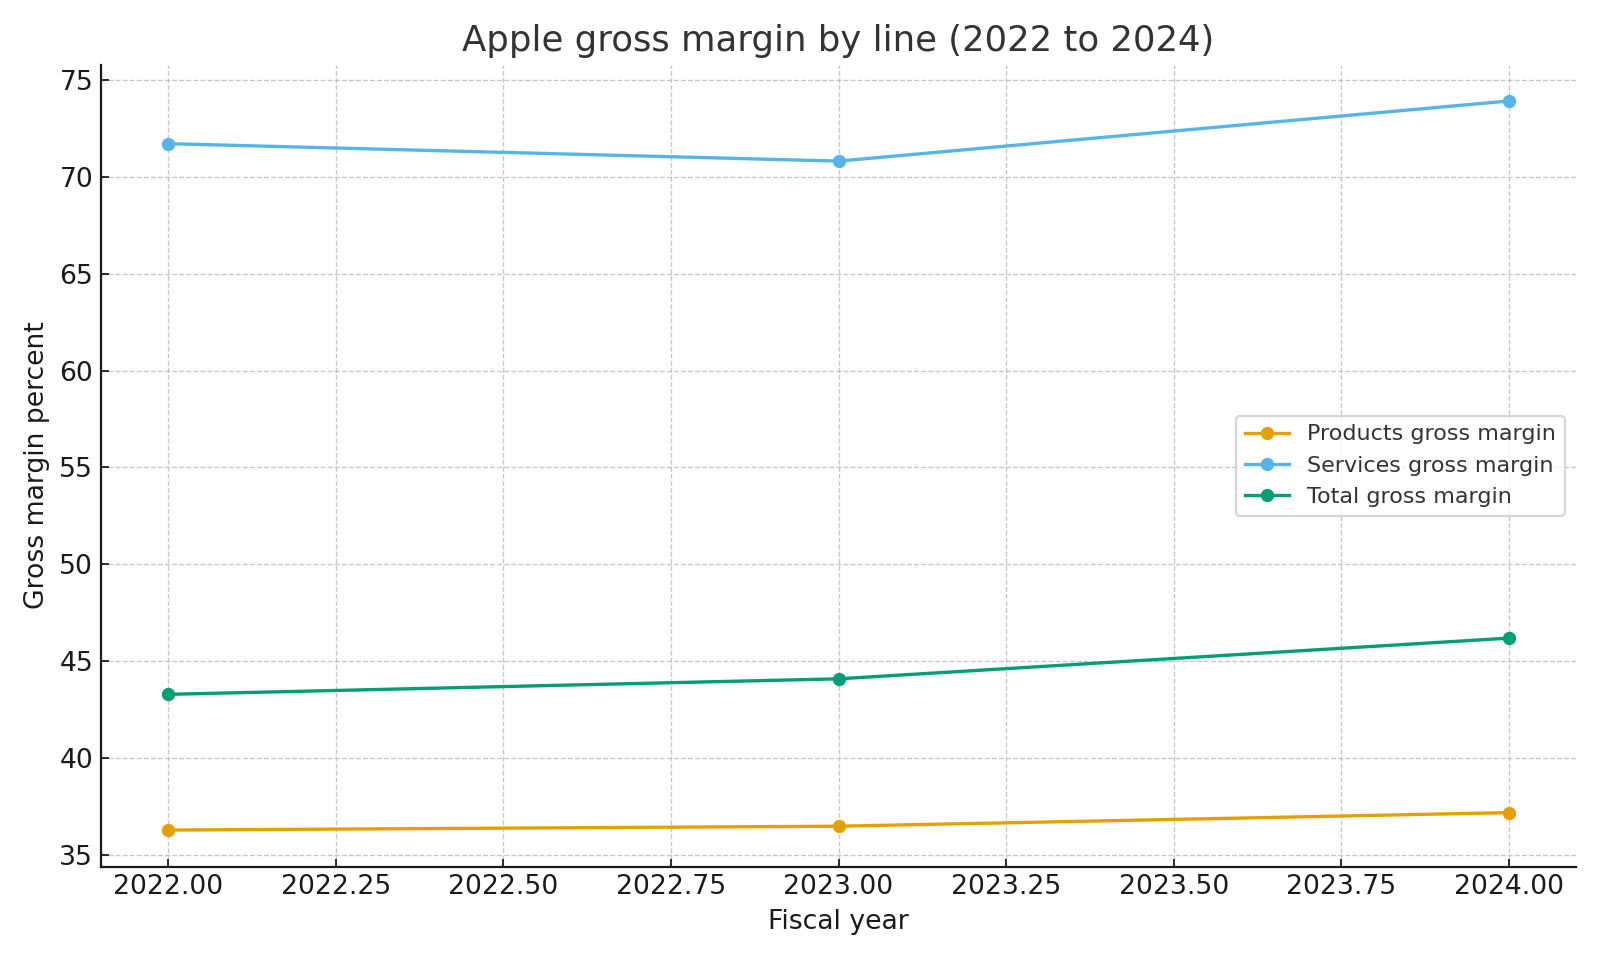 Products, services, and total gross margin 2022 to 2024
This means that even if total net sales are roughly flat, a shift toward services can lift profitability.
Where the revenue comes from
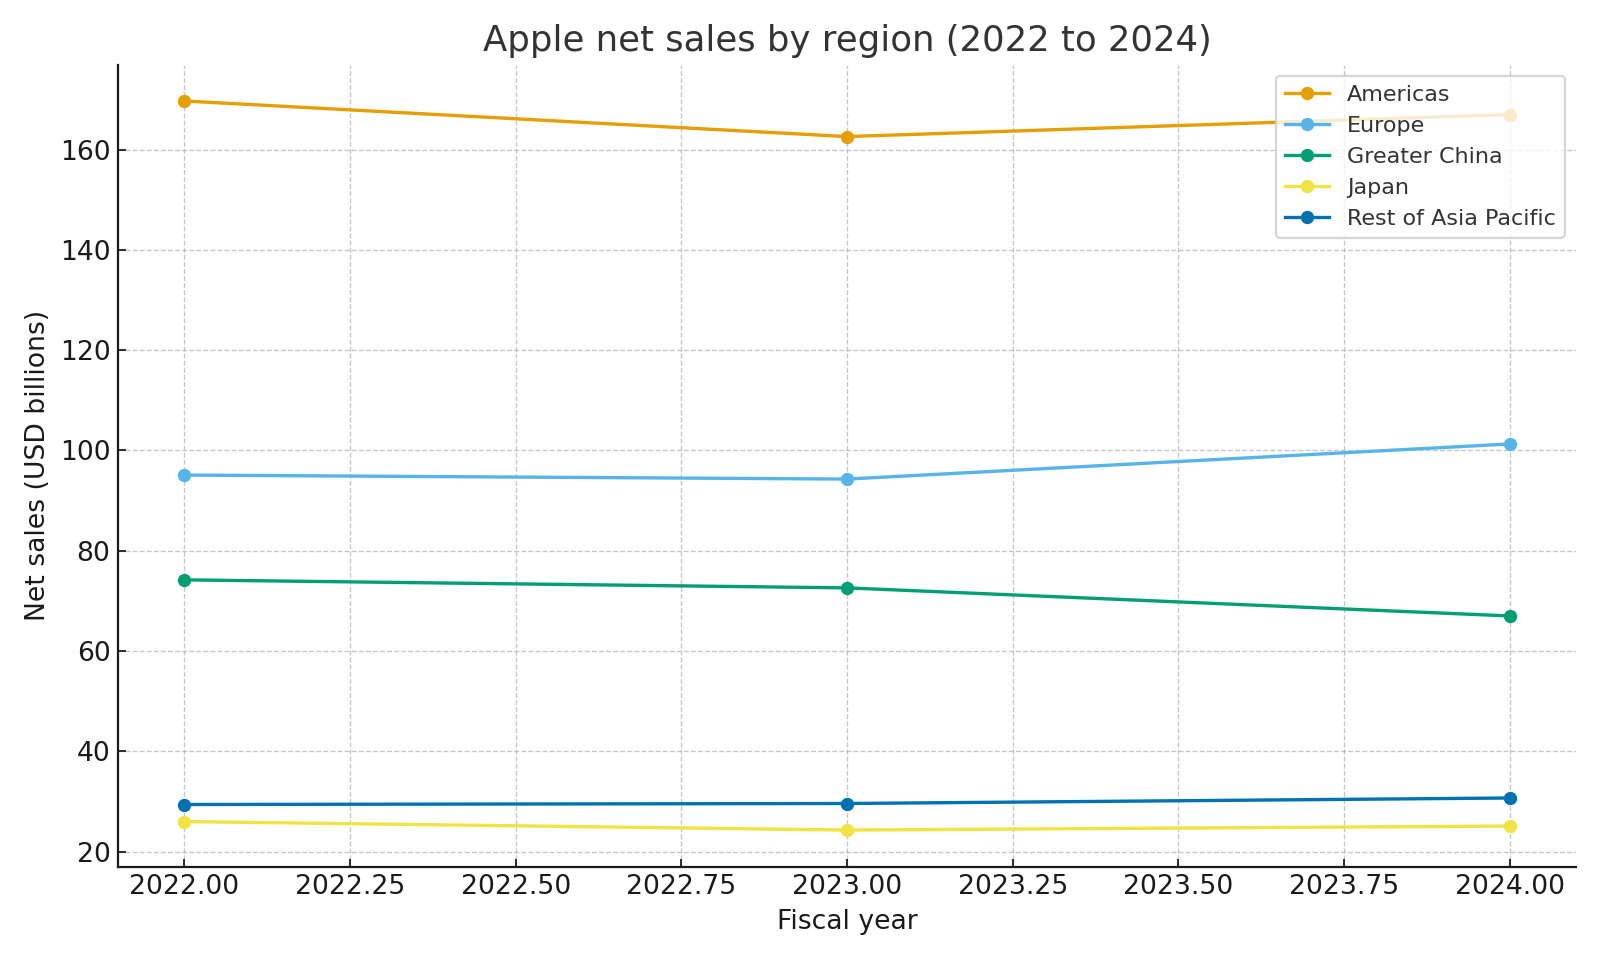
Apple reports five geographic segments: Americas, Europe, Greater China, Japan, and Rest of Asia Pacific. In 2024, the Americas generated about $167.0B in net sales, Europe about $101.3B, Greater China about $67.0B, Japan about $25.1B, and Rest of Asia Pacific about $30.7B. The chart below shows how these regions have moved from 2022 to 2024.
 Net sales by region 2022 to 2024
The Americas remain the largest region, but Europe and Greater China are also important, and the other regions together add meaningful diversification.
Why this model works
Devices bring users into the ecosystem and keep the installed base large. Services such as the App Store, iCloud, Apple Music, Apple TV, and payment services sit on top of that base and produce recurring, high margin revenue. As long as Apple can keep customers upgrading devices and using more services, the company can sustain strong cash generation even when hardware sales are not growing quickly.
Risks to keep in mind
Device sales can fluctuate with upgrade cycles, competition, and macroeconomic conditions. Services depend on regulation, platform rules, and the willingness of developers and partners to work within Apple’s ecosystem. Geographic concentration, especially in Greater China, creates exposure to local demand and policy. Legal and regulatory actions in areas such as app stores, payments, and digital markets could also affect margins and growth.
Sources
- Apple 2024 Form 10 K for consolidated net sales, operating income, net income, net sales by category, net sales by segment, and gross margin by products and services
- Apple 2022 and 2023 Form 10 K reports for prior year comparisons