Meta economics: ads, users, and the metaverse bet
TL;DR: Meta makes almost all of its money from advertising across Facebook, Instagram, WhatsApp, and Messenger. From 2022 to 2024, total revenue moved from about $116.6B to $134.9B to $164.5B. Net income climbed from about $23.2B to about $39.1B to about $62.4B. The core Family of Apps segment generates almost all of the revenue and profit, while Reality Labs brings in only a small slice of revenue and large operating losses.
Revenue and profit from 2022 to 2024
Revenue grew each year from 2022 through 2024 as digital ad demand recovered and Meta improved its ad systems. Net income grew much faster than revenue, helped by cost cuts in 2023 and stronger top line growth in 2024. Profit margins expanded as revenue grew and expenses grew more slowly.
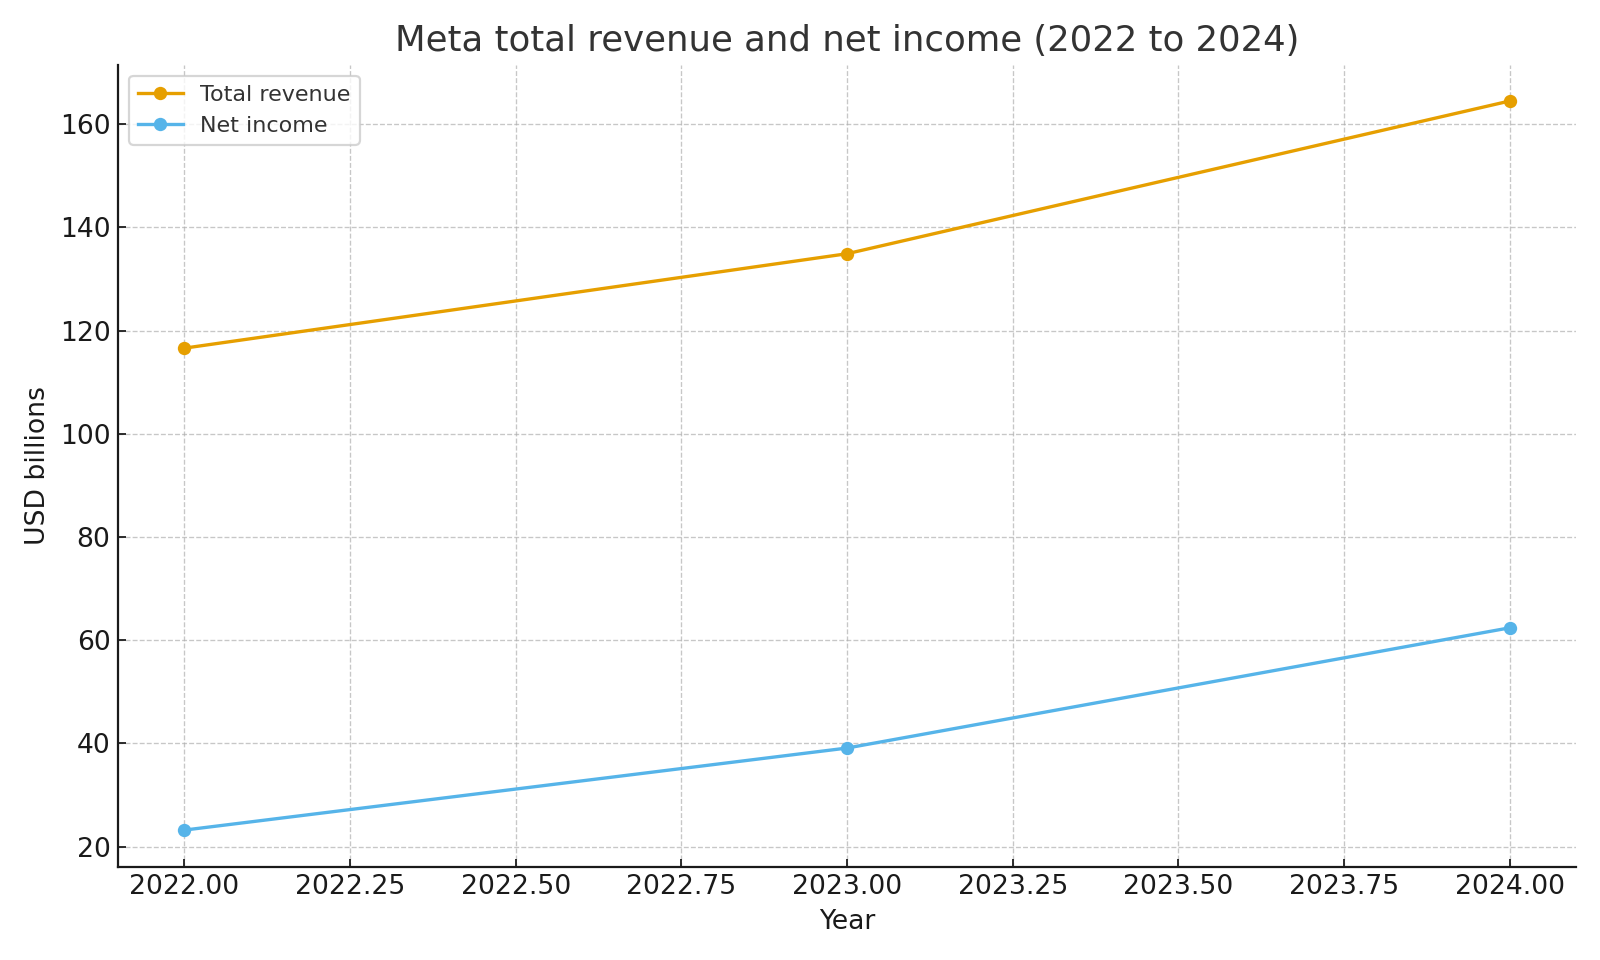 Total revenue and net income 2022 to 2024
Family of Apps versus Reality Labs
Meta reports two segments. Family of Apps includes Facebook, Instagram, Messenger, WhatsApp, and other services. Reality Labs covers virtual and augmented reality hardware, software, and content.
Family of Apps revenue increased from about $114.5B in 2022 to about $133.0B in 2023 and about $162.4B in 2024. Reality Labs revenue stayed small by comparison, moving from about $2.2B in 2022 to about $1.9B in 2023 and about $2.1B in 2024. Reality Labs also generated operating losses of roughly $13.7B in 2022, $16.1B in 2023, and $17.7B in 2024, while Family of Apps produced large operating profits.
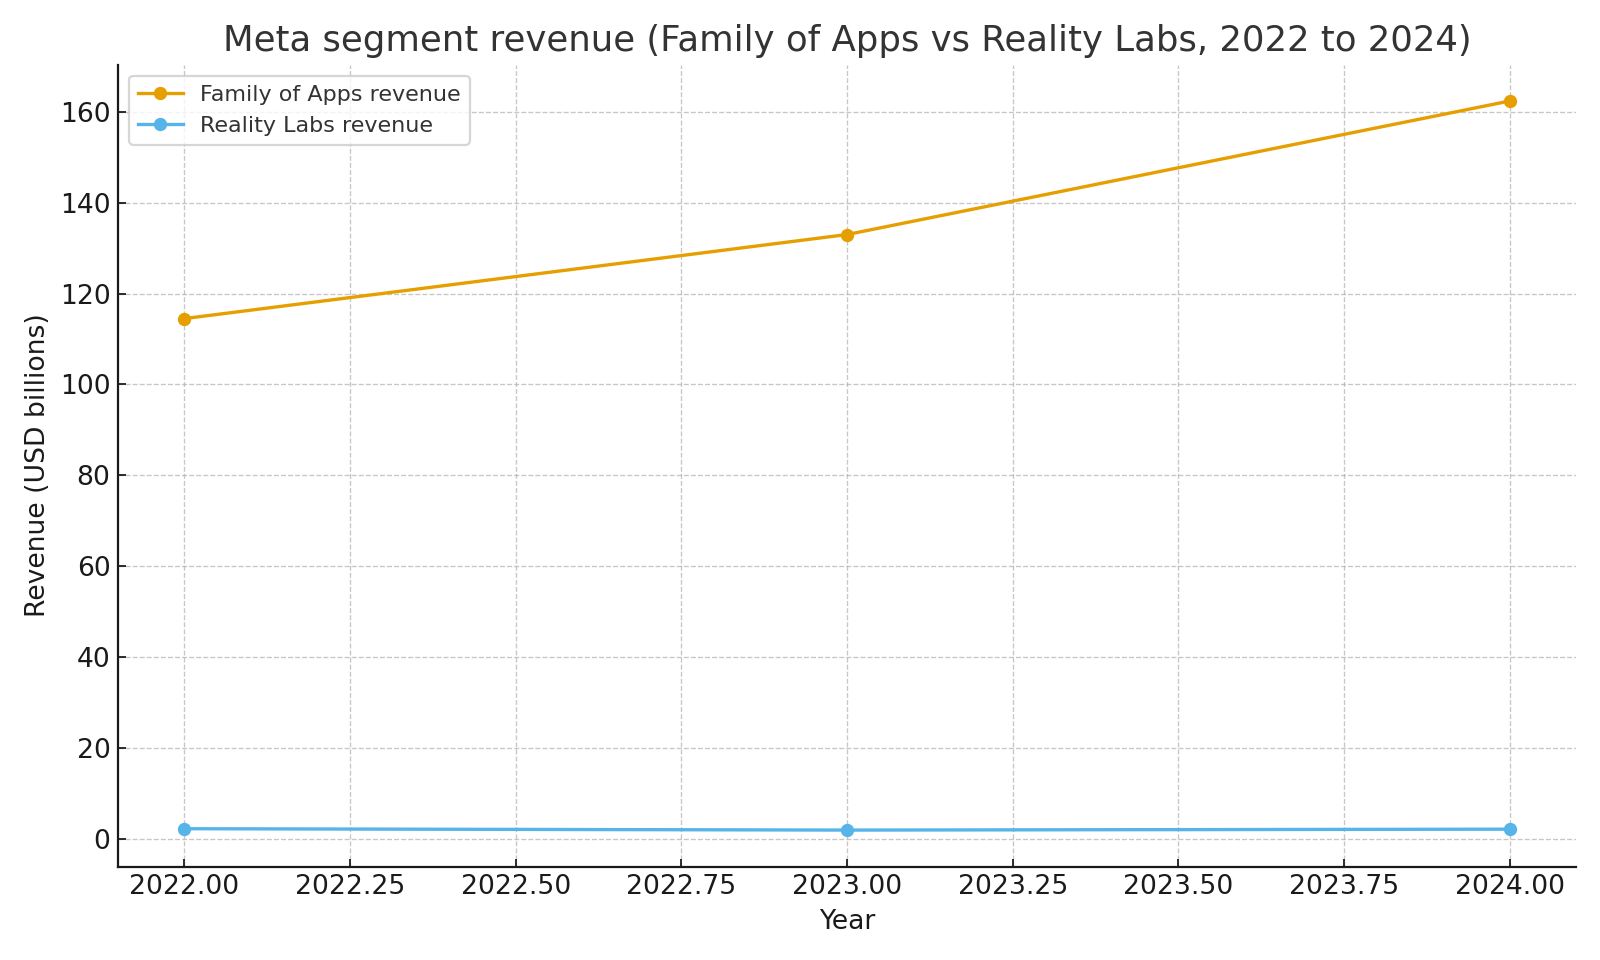 Segment revenue for Family of Apps and Reality Labs 2022 to 2024
Together, this shows that almost all of the company’s economics still come from advertising on the core apps. The metaverse and headsets remain a long term bet that costs real money today.
Where the revenue comes from
Revenue is split across the United States and Canada, Europe, Asia Pacific, and Rest of World. In 2022, the United States and Canada generated about $50.2B, Europe about $26.7B, Asia Pacific about $27.8B, and Rest of World about $12.0B. By 2024, those numbers had grown to roughly $63.2B for the United States and Canada, $38.4B for Europe, $45.0B for Asia Pacific, and $17.9B for Rest of World.
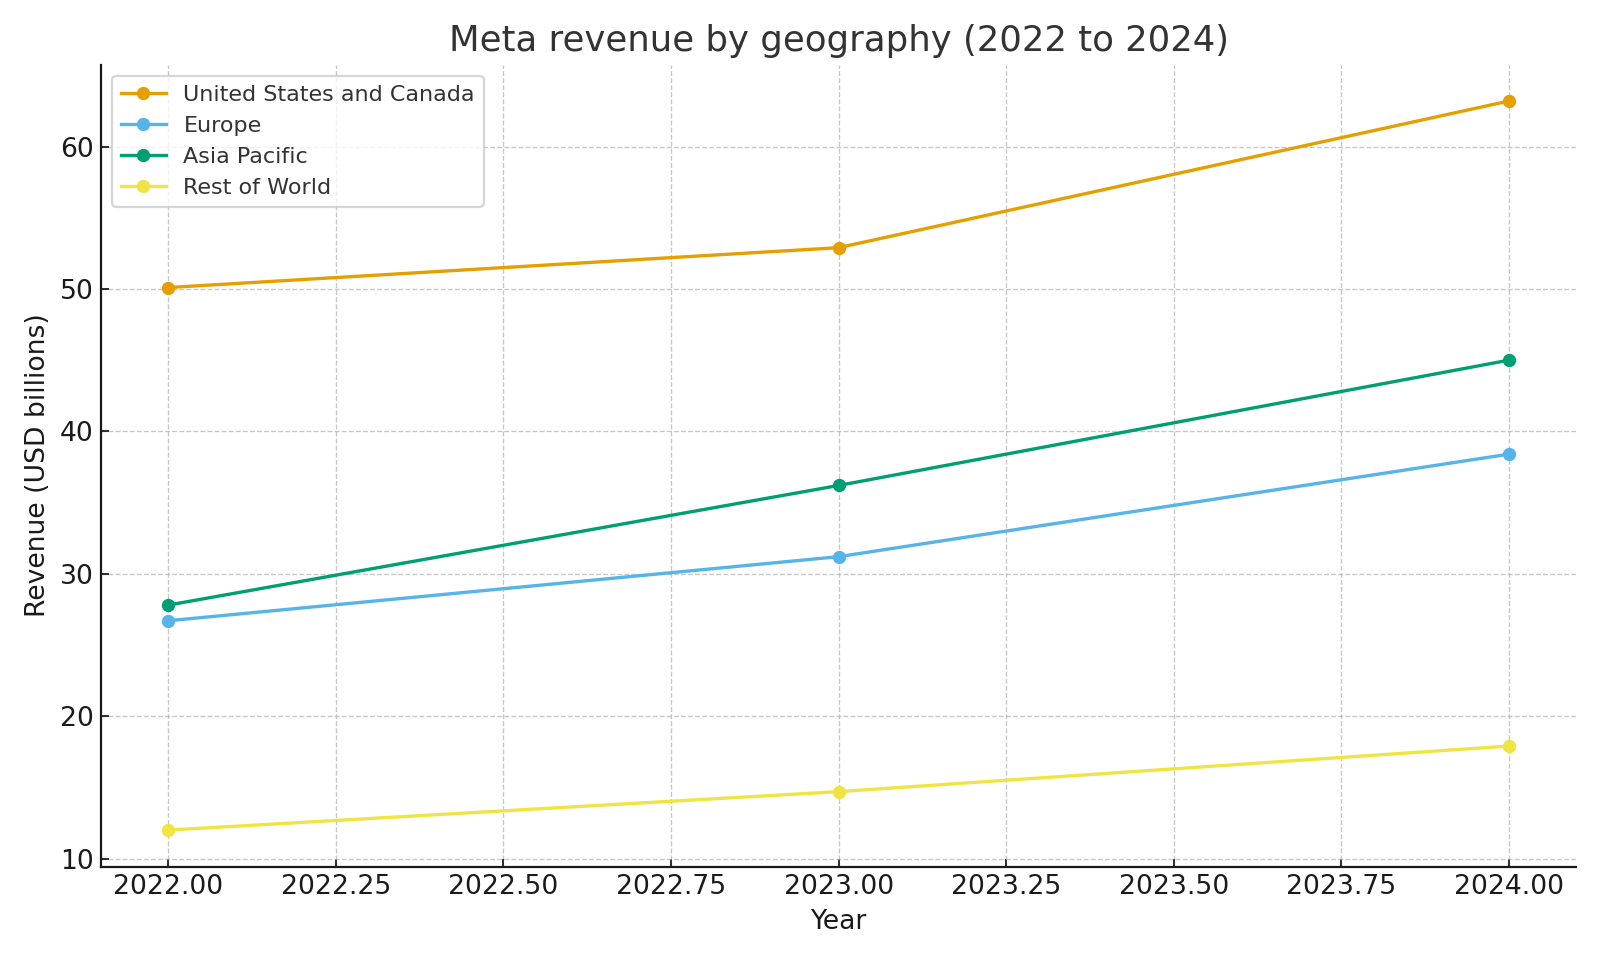 Revenue by geography 2022 to 2024
In 2024, the United States and Canada made up about 38.4 percent of revenue, Europe about 23.3 percent, Asia Pacific about 27.4 percent, and Rest of World about 10.9 percent. This mix shows that Meta is global, with a strong base in North America and Europe and growing exposure to Asia Pacific and other regions.
Users, impressions, and pricing
Meta’s ad revenue depends on how many people use the apps, how many ads they see, and how much advertisers pay for each ad. Family daily active people (DAP) were roughly 2.95 billion in late 2022, about 3.19 billion in late 2023, and about 3.35 billion in late 2024. That steady growth in people using at least one of the apps each day supports growth in ad impressions and revenue over time.
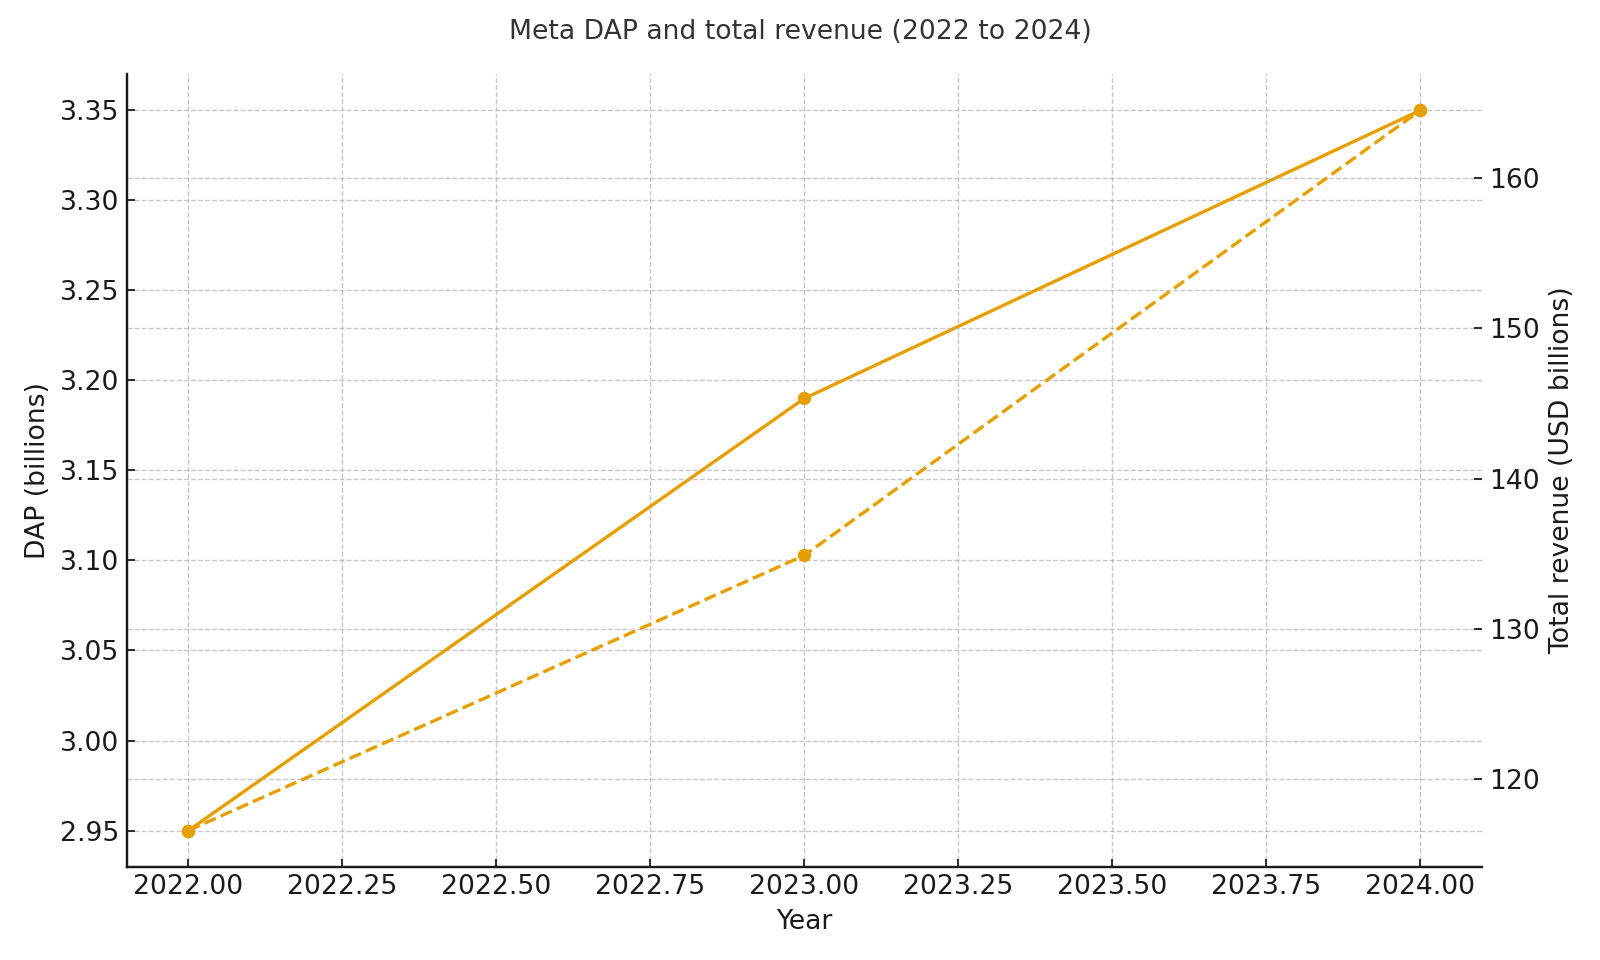 DAP and total revenue 2022 to 2024
Ad impressions and average price per ad moved in different ways over these three years. In 2023, ad impressions increased by about 28 percent, while the average price per ad fell by about 9 percent. In 2024, impressions increased by about 11 percent, and the average price per ad rose by about 10 percent. The index chart below uses 2022 as a base year and shows how volume and pricing moved together.
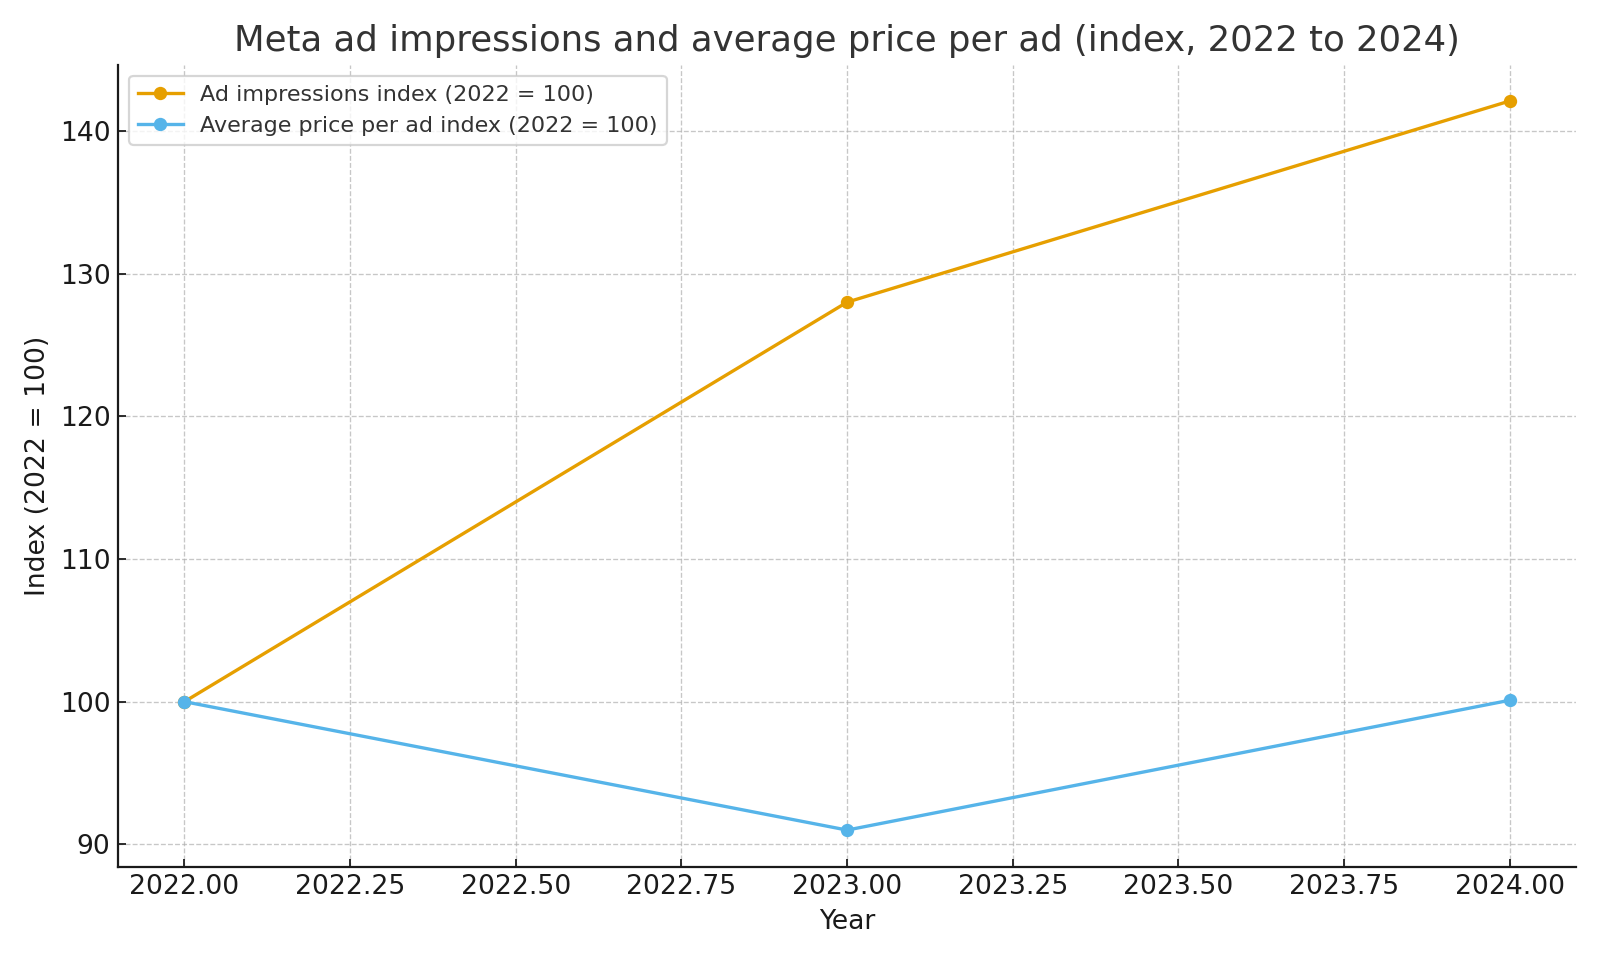 Ad impressions and average price per ad index 2022 to 2024
This pattern suggests that Meta first leaned on higher ad volume to drive revenue during a tougher pricing environment, then saw both volume and pricing help revenue in 2024 as ad demand improved.
Why this model works
Meta’s core economics come from a large and engaged user base and powerful ad tools. The apps collect many signals about user behavior, which helps advertisers reach specific audiences and measure results. As daily active people and ad impressions grow, and as the average price per ad improves, revenue can scale faster than many of the fixed costs of running the platforms and data centers.
Risks to keep in mind
Regulation is a major risk. Privacy rules, app store rules, and competition laws in the United States, Europe, and other regions can limit how Meta uses data for ad targeting and measurement. Reality Labs continues to lose large amounts of money, and there is no guarantee that metaverse hardware will ever justify those investments. Competition from other social and short video apps can also pull user attention and ad budgets away.
Sources
- Meta Platforms 2022, 2023, and 2024 Form 10 K filings for revenue, net income, segment results, revenue by geography, and user and advertising metrics
- Meta earnings releases and investor presentations for commentary on Family metrics, ad impressions, and pricing trends