Uber economics: rides, deliveries, and scale
TL;DR: Uber connects riders, drivers, couriers, and restaurants on one platform. From 2022 to 2024, revenue rose from about $31.9B to about $44.0B. Net income moved from a loss of about $9.1B in 2022 to a profit of about $1.9B in 2023 and about $9.9B in 2024. Gross bookings and trips grew each year as more people used both Mobility and Delivery.
Revenue and profit
Uber became profitable on a full year basis in 2023 and posted a much larger profit in 2024. The sharp swing in net income in 2022 and 2023 reflects not only the core business but also gains and losses on equity investments and tax items. When you look at the longer trend, revenue has stepped up every year and net income has moved from deep losses to solid profit.
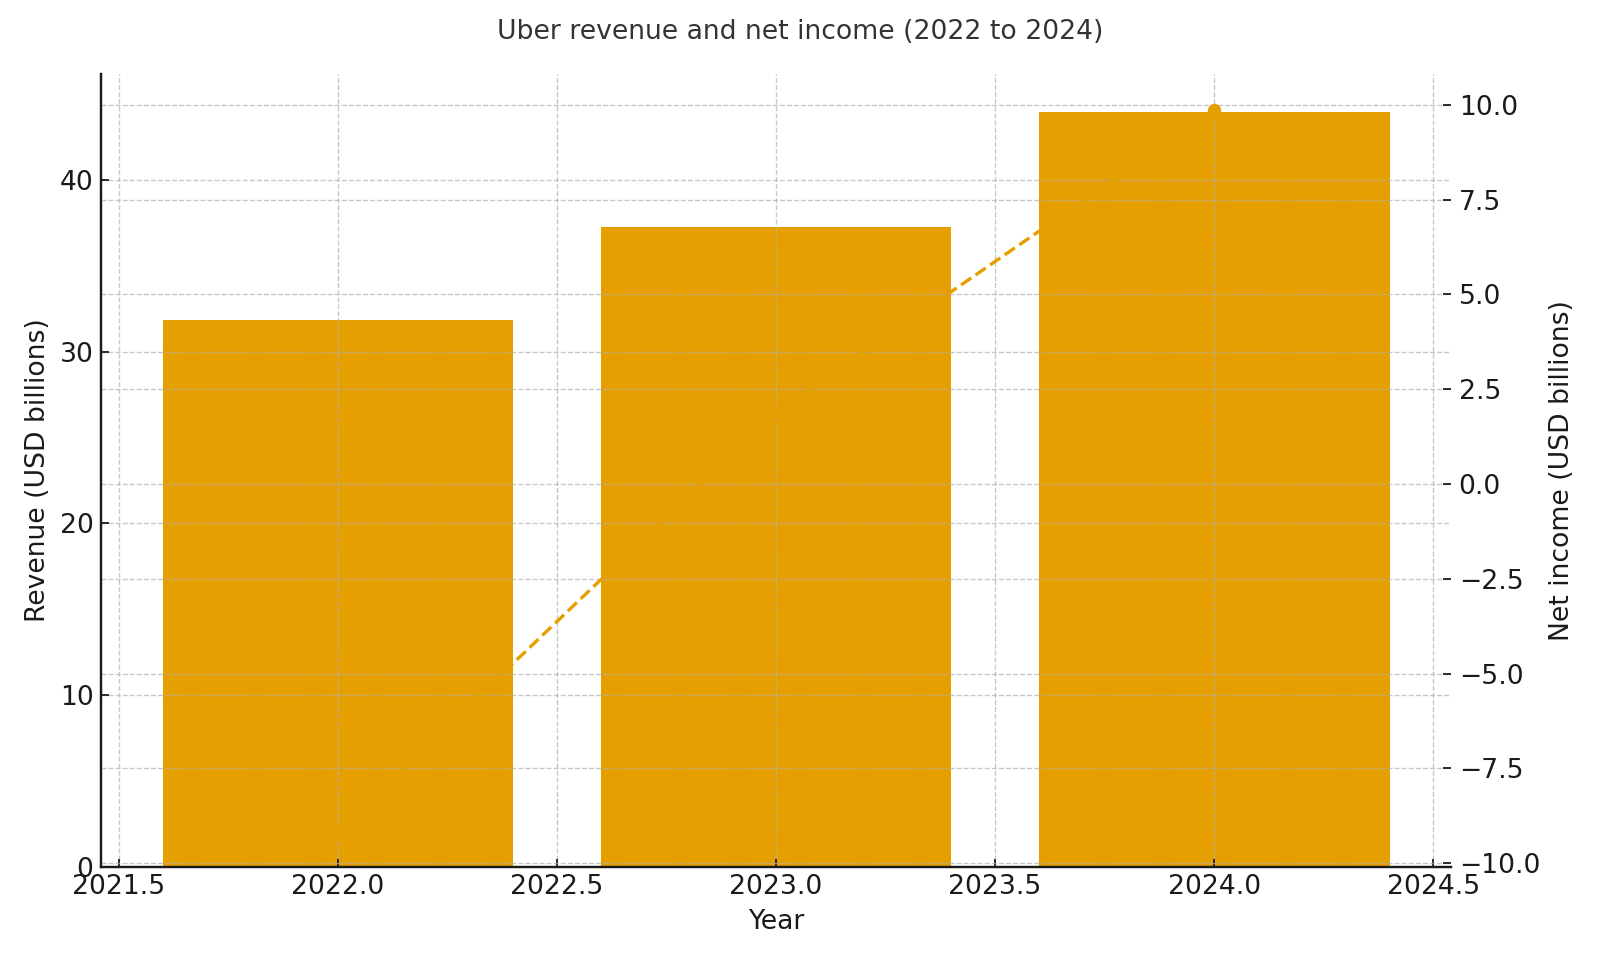 Revenue and net income 2022 to 2024
Gross bookings and trips
Gross bookings measure the total dollar value of rides and deliveries before the company’s take rate. They climbed from about $115B in 2022 to about $138B in 2023 and about $163B in 2024. Trips rose from about 7.6B to 9.4B to 11.3B over the same period. The link between bookings and trips shows that growth has come from more usage as well as higher spend per trip.
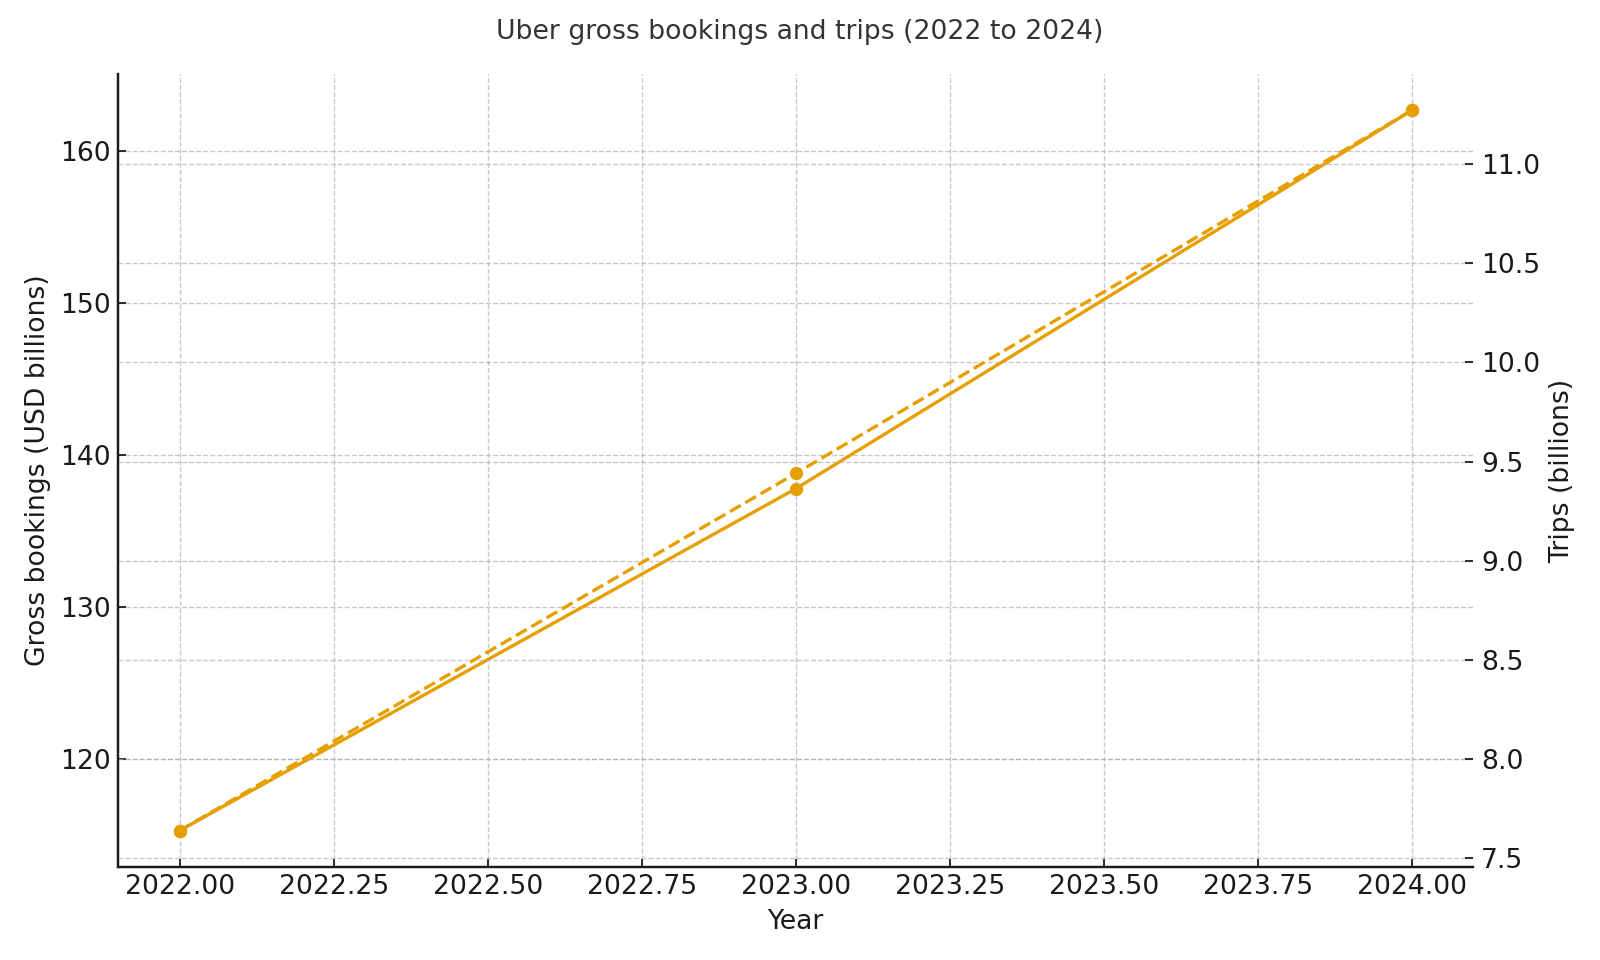 Gross bookings and trips 2022 to 2024
Revenue by segment
Uber reports three main segments. Mobility covers rides, Delivery covers food and other items, and Freight focuses on logistics. Mobility revenue grew from about $14.0B in 2022 to about $25.1B in 2024. Delivery revenue increased from about $10.9B to about $13.8B. Freight revenue declined from about $6.9B in 2022 to about $5.1B in 2024 as the freight market softened.
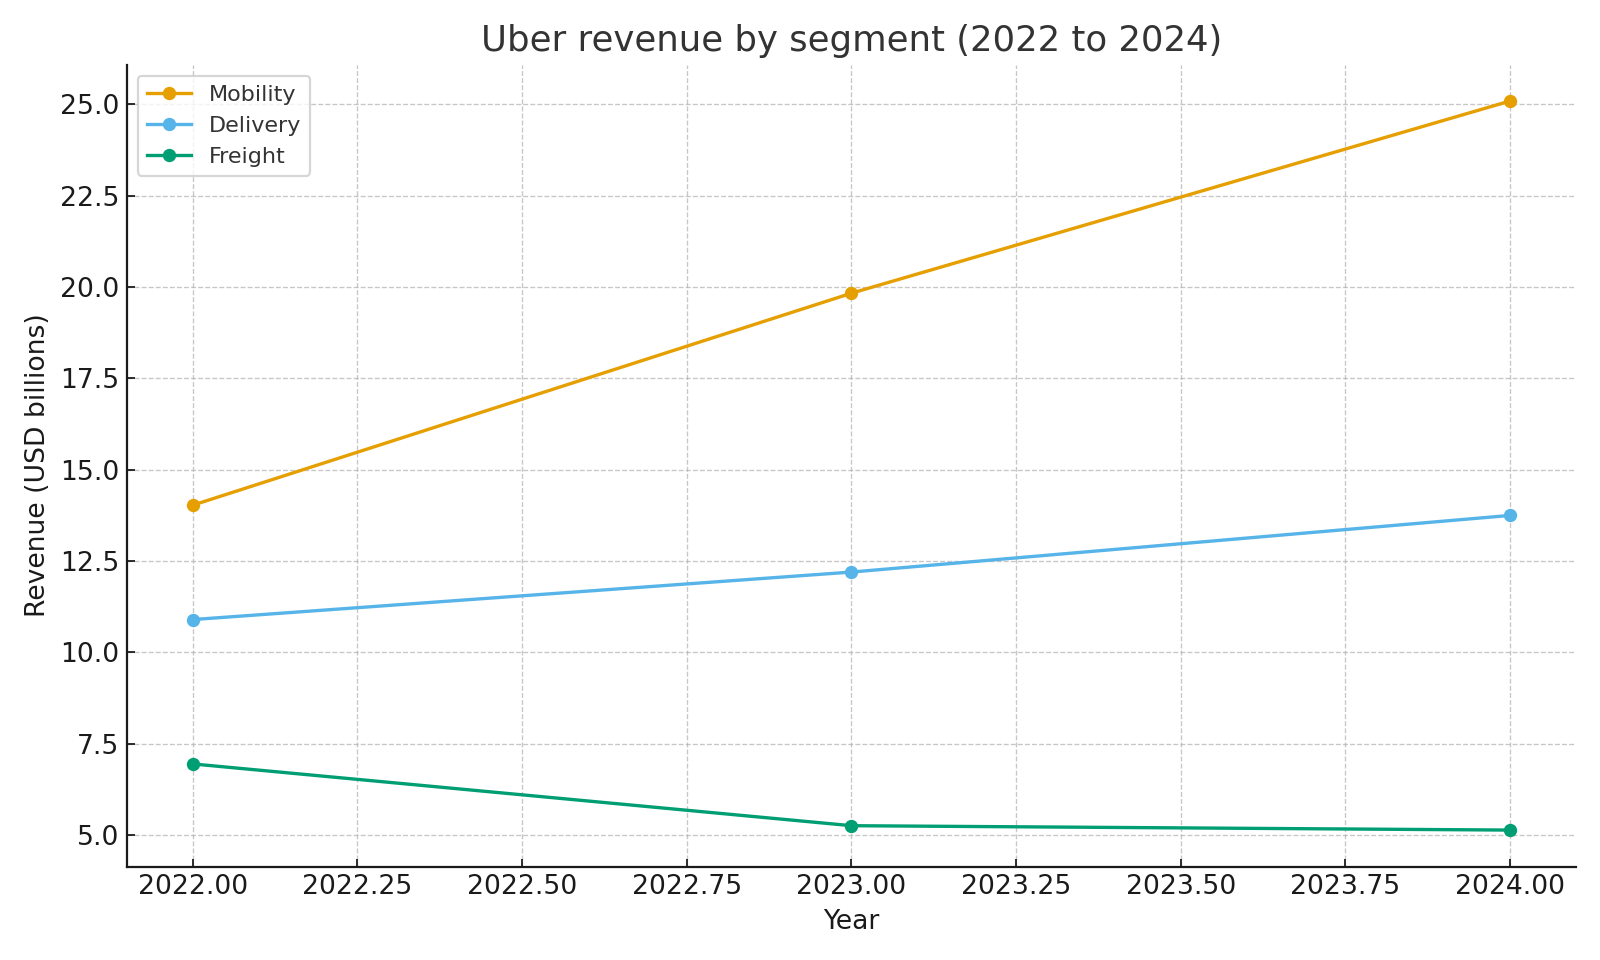 Revenue by segment 2022 to 2024
These lines show that Mobility is now the largest source of revenue, with Delivery a strong second and Freight smaller and more cyclical.
Where the revenue comes from in the world
Region data for 2022 to 2024 show that the United States and Canada are the largest market. In 2024, revenue from that region was about $27.4B. Europe, the Middle East, and Africa generated about $10.1B. Asia Pacific brought in about $4.3B, and Latin America about $2.1B. All regions grew over this period, but the Americas and EMEA contributed the largest dollar gains.
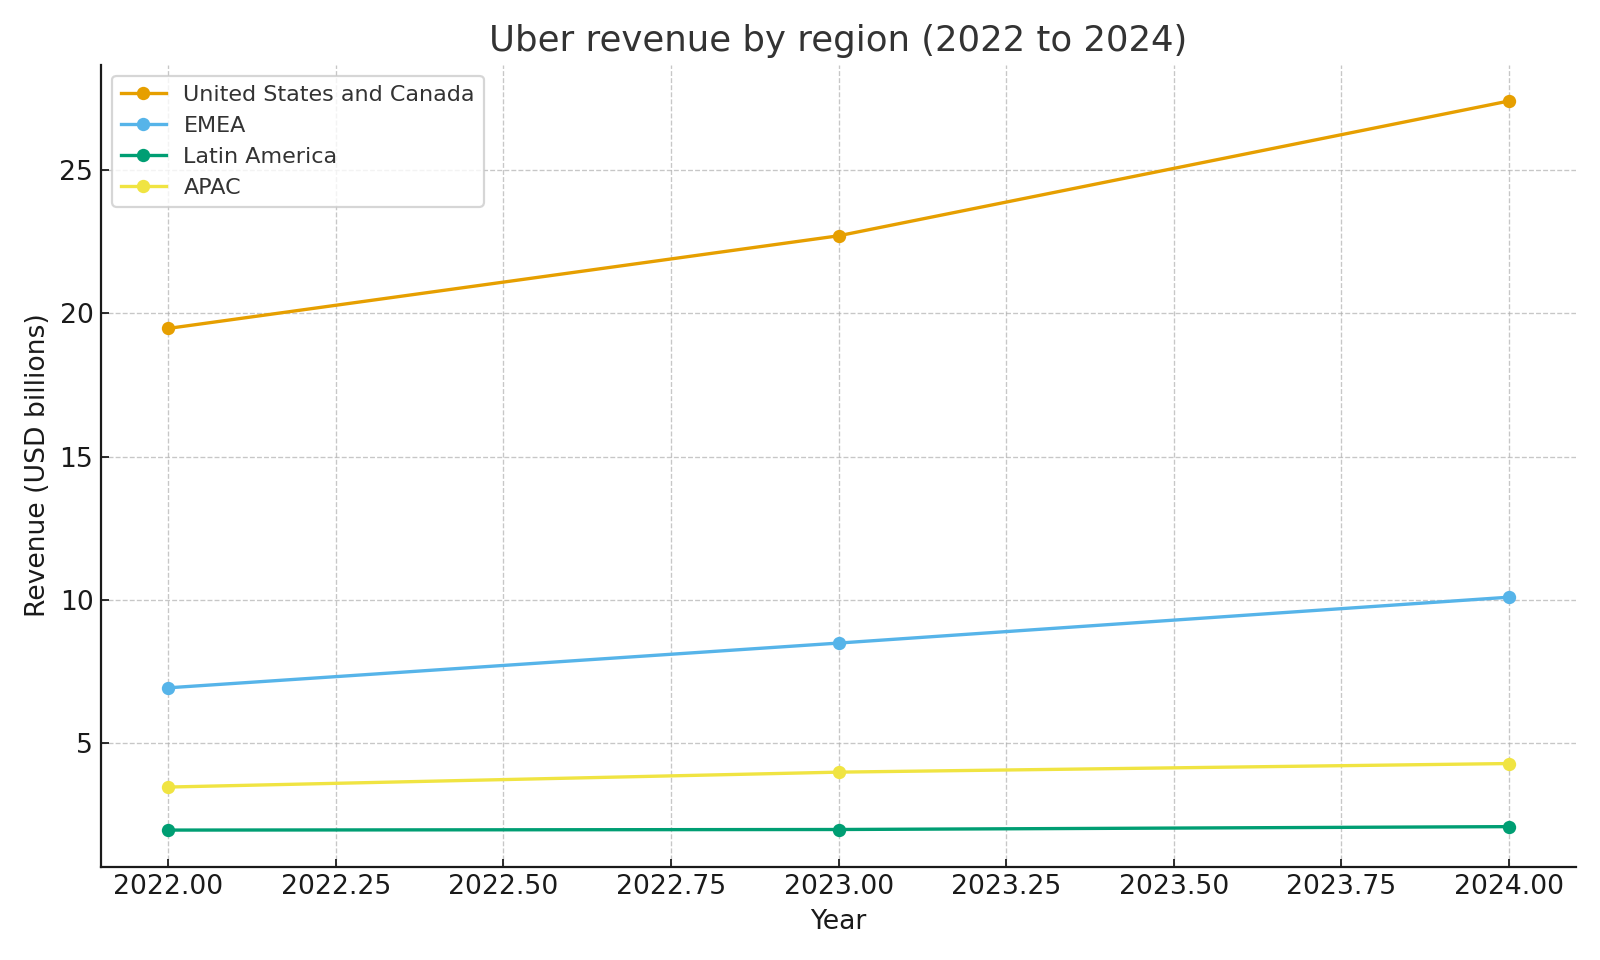 Revenue by region 2022 to 2024
Revenue and expenses together
Total expenses were higher than revenue in 2022 and 2023, which led to net losses in 2022 and only modest profit in 2023. In 2024, revenue was about $44.0B and total expenses were about $41.2B, which helped support the move to consistent profit. Higher scale, better cost control, and improved take rates all played a part.
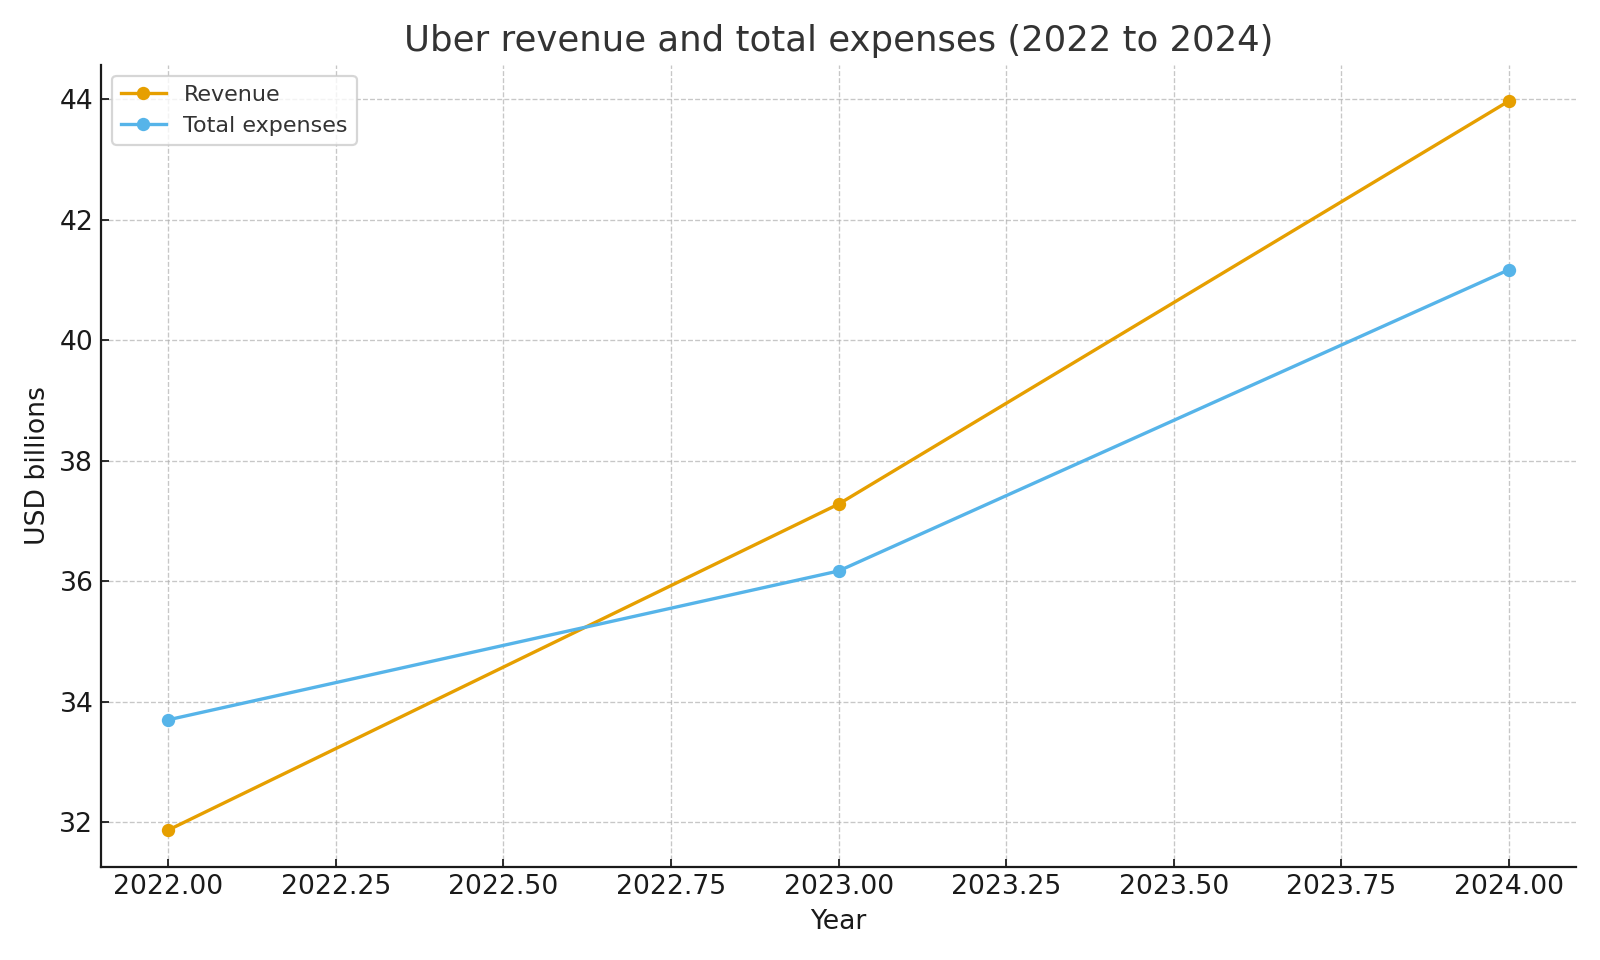 Revenue and total expenses 2022 to 2024
Why this model works
Uber’s platform benefits from network effects. More riders attract more drivers, and more couriers attract more restaurants and merchants. That flywheel can lower wait times and improve reliability, which keeps users on the platform. Dynamic pricing and a mix of Mobility, Delivery, and Freight help the company balance demand and supply and improve overall margin as the business grows.
Risks to keep in mind
A large share of the recent profit improvement comes from higher take rates and from gains and tax items that may not repeat. Regulation of gig work can change cost structures in key markets. Competition from other ride and delivery apps can pressure prices, driver pay, and incentives. Currency and macroeconomic shifts can also affect bookings and spending.
Sources
- Uber 2022, 2023, and 2024 annual reports and earnings releases for revenue, gross bookings, trips, and segment and region results
- DemandSage summary of Uber statistics for consolidated revenue, net income, gross bookings, trips, segment revenue, and region revenue tables